Page Contents
Introduction
The ELK stack is a group of open-source software packages used to manage logs. It’s typically used for server logs but is also flexible for any project that generates large sets of data.
- Logstash will collect your log data, converts it into JSON document, and store it in Elasticsearch.
- Kibana is an open-source data visualization tool for Elasticsearch. Kibana allows us to manage and visualize data from Elasticsearch.
What Does the ELK Stack Stand For?
ELK stands for Elasticsearch, Logstash, and Kibana. They are the three components of the ELK stack that can be used to index, collect and visualize the data.
Elasticsearch –Core of the Elastic software. Elasticsearch is a search and analytics engine used to sort through data.
Logstash – Collects the data from various sources, collates it, and directs it to storage. As its name suggests, it collects and “stashes” your log files.
Kibana – Kibana is a graphical tool for visualizing data and generate the charts and graphs.
Installation Steps
- Step 1: Prerequisites
- Step 2: Install OpenJDK 8 Java
- Step 3: Add Elasticsearch Repositories
- Step 4: Install and set up Elasticsearch
- Step 5: Install and Set Up Kibana
- Step 6:Install and Set Up Logstash
- Step 7: Install Filebeat
- Step 8: Testing
Prerequisites
- A system with CentOS 8 installed (64 bit with 4GB of RAM)
- Access to a terminal window/command line (Search > Terminal)
- A user account with sudo access
- Java version 8
Install OpenJDK 8 Java
Skip this step if Java 8 is already installed on the machine.
Open a new terminal window and execute the following command
sudo yum install java-1.8.0-openjdkThe system will check the repositories, then prompt you to confirm the installation. Type Y then Enter.

Add Elasticsearch Repositories
The ELK stack can be downloaded and installed using the YUM package manager. However, the software isn’t included in the default repositories.
Import the Elasticsearch PGP Key
In a new terminal , execute below command
sudo rpm ––import https://artifacts.elastic.co/GPG-KEY-elasticsearch
This will add the Elasticsearch public signing key to your system. This key will validate the Elasticsearch software when you download it.
Add Elasticsearch RPM Repository
We have to create the repository config file in /etc/yum.repos.d/. Follow the steps mentioned below
cd /etc/yum.repos.d/Next, create the config file
sudo vi elasticsearch.repoAdd below mentioned lines in the file.
[elasticstack]
name=Elastic repository for 7.x packages
baseurl=https://artifacts.elastic.co/packages/7.x/yum
gpgcheck=1
gpgkey=https://artifacts.elastic.co/GPG-KEY-elasticsearch
enabled=1
autorefresh=1
type=rpm-md
Finally, update package lists.
dnf updateInstall and set up Elasticsearch
- Install Elasticsearch
- Configure Elasticsearch
- Start Elasticsearch
- Test Elasticsearch
Install Elasticsearch
Lets install Elasticsearch now. In a new terminal, type below command
sudo dnf install elasticsearchThis will scan all the repositories for the Elasticsearch package.The system will calculate the download size, then prompt you to confirm the installation. Type Y then Enter. Installation is done.
Configure Elasticsearch
Once the installation is done, open and edit the /etc/elasticsearch/elasticsearch.yml configuration file
sudo vi /etc/elasticsearch/elasticsearch.ymlUncomment and modify the property network.host. Modify the network.host to your server’s IP address or set it to localhost if setting up a single node locally. Uncomment the property http.port as well.
# Set the bind address to a specific IP
network.host: localhost
# Set a custom port for HTTP:
http.port: 8888
Start Elasticsearch
Reboot the system for the changes to take effect:
sudo rebootStart the elasticsearch service using below aommand
sudo systemctl start elasticsearchThere will be no output if the command was executed correctly.
Now, set the service to launch at boot:
sudo systemctl enable elasticsearchTest Elasticsearch
Test the software to make sure it responds to a connection:
curl –X GET “localhost:8888”The system should display a whole list of information. On the second line, you should see that the cluster_name is set to elasticsearch. This confirms that Elasticsearch is running, and listening on Port 8888.
Install and Set Up Kibana
- Install Kibana
- Configure Kibana
- Start and Enable Kibana
- Test Kibana
Install Kibana
Kibana is a graphical interface for parsing and interpreting log files. Kibana uses the same GPG key as Elasticsearch, so you don’t need to re-import the key. Additionally, the Kibana package is in the same ELK stack repository as Elasticsearch.
To install Kibanaa, open a terminal window, enter the below command
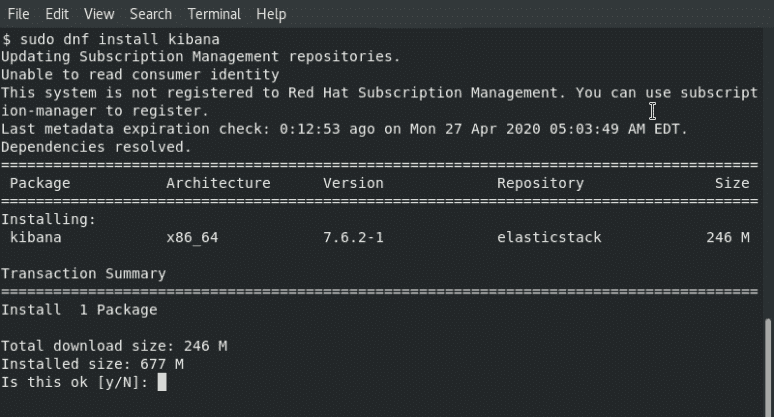
sudo dnf install kibanaType y when asked for confirmation and then Enter and allow the process to finish.

Configure Kibana
Open and edit the .yml configuration file for Kibana.
sudo vi /etc/kibana/kibana.ymlUncomment the properties – server.port, server.host and elasticsearch.hosts
server.port: 5601
server.host: “localhost”
elasticsearch.hosts: [“http://localhost:9200”]
Start and Enable Kibana
Next, start and enable the Kibana service. Open a new terminal and execute below commands.
sudo systemctl start kibana
sudo systemctl enable kibana
Allow Traffic on Port 5601
If firewall is enabled on your CentOS system, you need to allow traffic on port 5601. In a terminal window, run the following command:
firewall-cmd --add-port=5601/tcp --permanentNow reload the firewall service:
firewall-cmd --reload
Test Kibana
Open a web browser, and enter the following address:
http://localhost:5601The system should start loading the Kibana dashboard.

Install and Set Up Logstash
- Install Logstash
- Configure Logstash
- Start Logstash
Install Logstash
Logstash is a tool which collects data from different sources. The data collected by Logstash is parsed by Kibana and stored in Elasticsearch.
Like other parts of the ELK stack, Logstash uses the same Elastic GPG key and repository.
To install logstash , open a new terminal window and execute below command. When asked for confirmation, type Y and hit Enter to confirm the install.
sudo dnf install logstashConfigure Logstash
Store all custom configuration files in the /etc/logstash/conf.d/ directory. The configuration largely depends on your use case and plugins used.
Start Logstash
Start and enable the Logstash service using the commands mentioned below
sudo systemctl start logstash
sudo systemctl enable logstash
You should now have a working installation of Elasticsearch, along with the Kibana dashboard and the Logstash data collection pipeline.
Install Filebeat
To simplify logging, install a lightweight module called Filebeat. Filebeat is a shipper for logs that centralizes data streaming.
To install Filebeat, open a terminal window and execute the below command:
sudo yum install filebeatNext, add the system module, which will examine the local system logs:
sudo filebeat modules enable systemNext, run the Filebeat setup:
sudo filebeat setupNow start the Filebeat service using below command
sudo service filebeat startLaunch your Kibana dashboard in a browser by visiting the following address:
http://localhost:5601On the left column, click the Logs tab. Find and click the Stream live link. You should now see a live data stream for your local log files.

Testing
Open your web browser and type the Elastic Stack installation domain name on the address bar.
Now log in to the Kibana Dashboard using the basic authentication account that you’ve created.

And you will get the Kibana Dashboard as below.

Now connect to the elasticsearch index data that automatically got created after the filebeat connected to the logstash. Click on the ‘Connect to your Elasticsearch index‘ link.
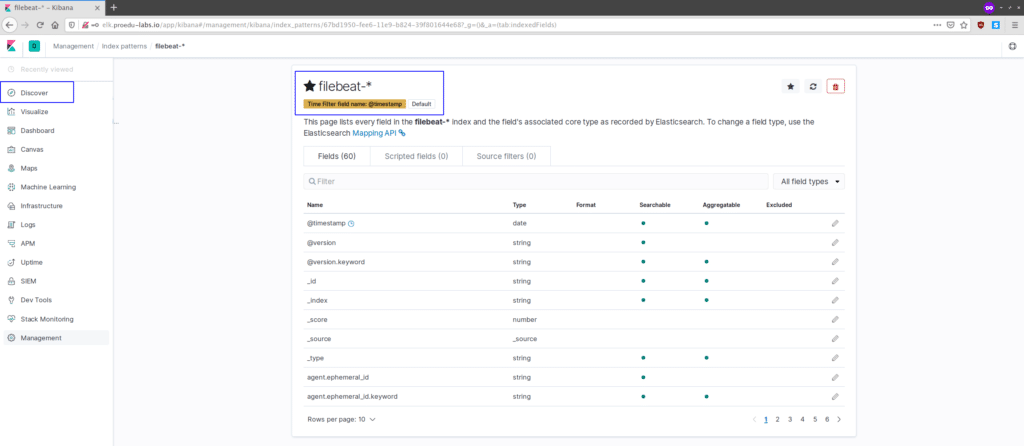
Create the ‘filebeat-*‘ index pattern and click the ‘Next step‘ button.

For the filter name, choose the ‘@timestamp‘ filter and click the ‘Create index pattern‘.

And the ‘filebeat-*‘ index pattern has been created, click the ‘Discover‘ menu on the left.
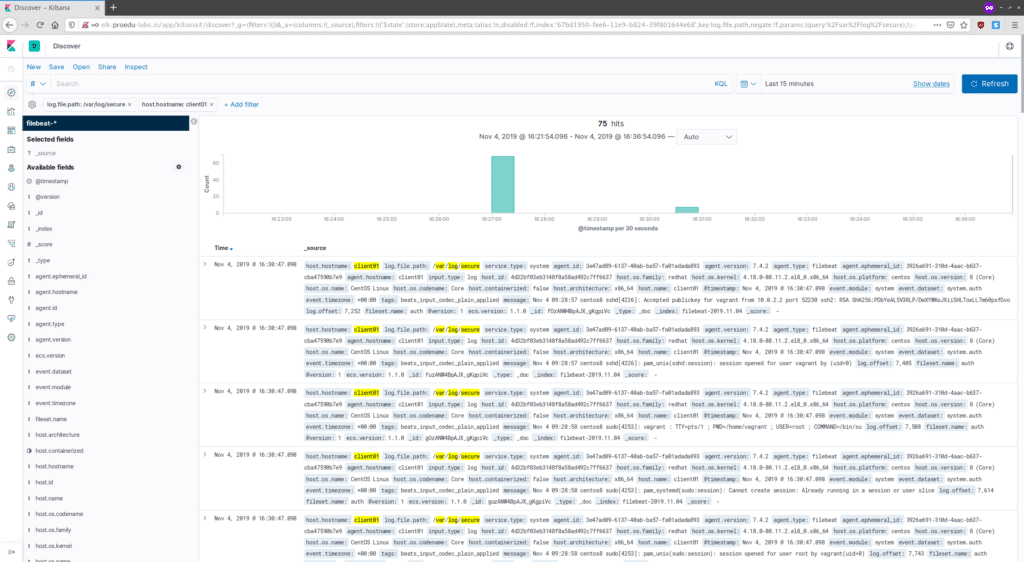
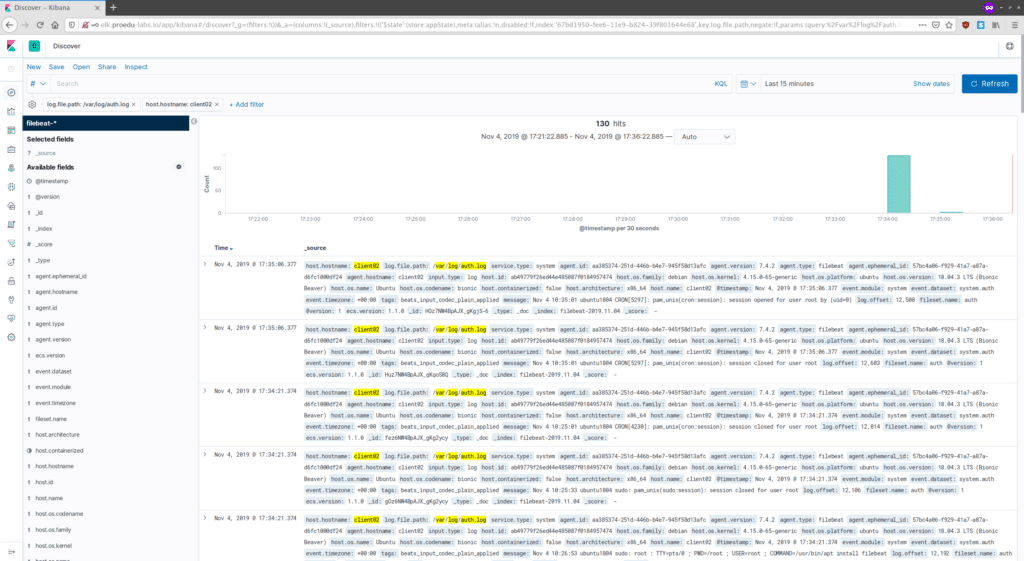
And you will get the log data from filebeat clients as below.

Logs for CentOS 8 system.

Log for the Ubuntu system.

As a result, the log data that defined on the filebeat system module has been shipped to the elastic stack server.
And the Elastic Stack installation and configuration on CentOS 8 has been completed successfully.